Gold has experienced a turbulent 2026, surging above $5,500 before falling below $4,000 and staging a fresh recovery. With central banks and ETFs supporting demand, rising yields, currency movements and weakening consumer purchases continue to challenge the rally. Giancarlo Prisco examines the forces shaping gold prices, the risks investors should monitor and whether the latest rebound signals a sustainable recovery or another period of volatility.
JURIS Editorial
After the rally and the correction, the metal is moving higher again. But the question that matters is not just how far it can rise: it is which forces are supporting the price and which could hold it back.
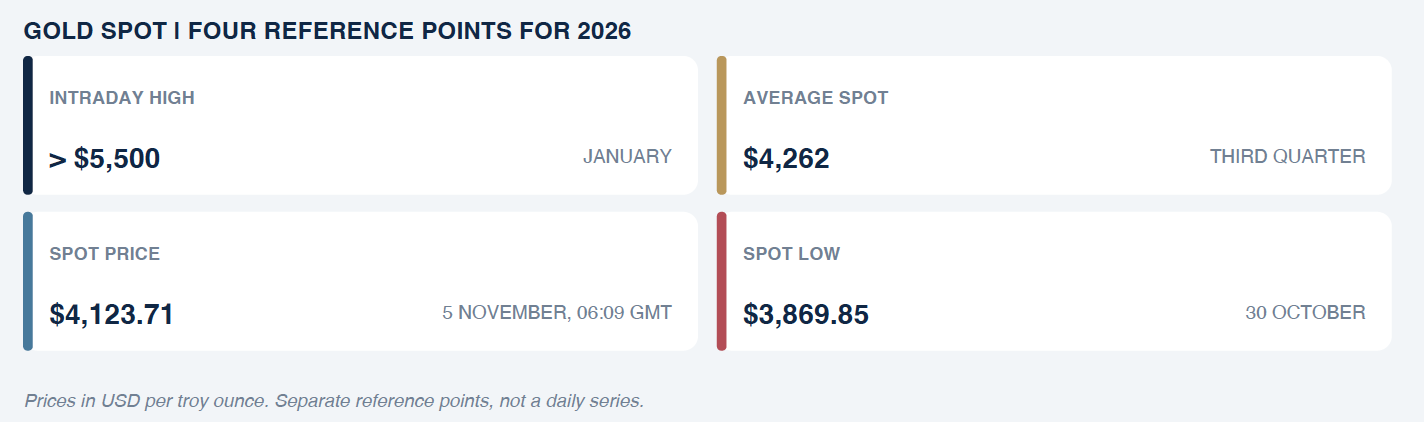
Gold has been through an extreme 2026. In January it rose above $5,500 an ounce intraday; on 30 October it fell to $3,869.85, its lowest level in around a year. After the US elections it rebounded: on the morning of 5 November spot touched $4,123.71, with the dollar and yields retreating. The recovery is significant, but it remains a short-term reaction within a market that has already shown it can move violently in both directions.
The fundamental picture is not one-dimensional. Central bank purchases and ETF inflows supported investment demand in the third quarter. At the same time, high prices reduced purchases of jewellery, bars and coins. Gold benefits from uncertainty, but pays an opportunity cost when real yields and the dollar rise.
The thesis of this report: the demand structure remains solid, but the price already reflects a significant premium for protection and momentum. For the rebound to turn into a more stable recovery, it needs sustained flows, less punitive yields and the price holding above the psychological $4,000 area. A single rebound is not enough to prove it.
Prices in US dollars per troy ounce. Spot price as at 06:09 GMT on 5 November; demand and supply figures refer to the third quarter of 2026.
In the third quarter, global demand including the over-the-counter market was 1,369 tonnes, down 1% year on year. Its value, however, rose 22% to $188 billion. In the first nine months demand reached 3,881 tonnes, almost as much as the record for the whole of 2025; cumulative value hit a high of $566 billion. The divergence between volume and value shows how far the high price is supporting the nominal figures even as some buyers cut back on volumes.
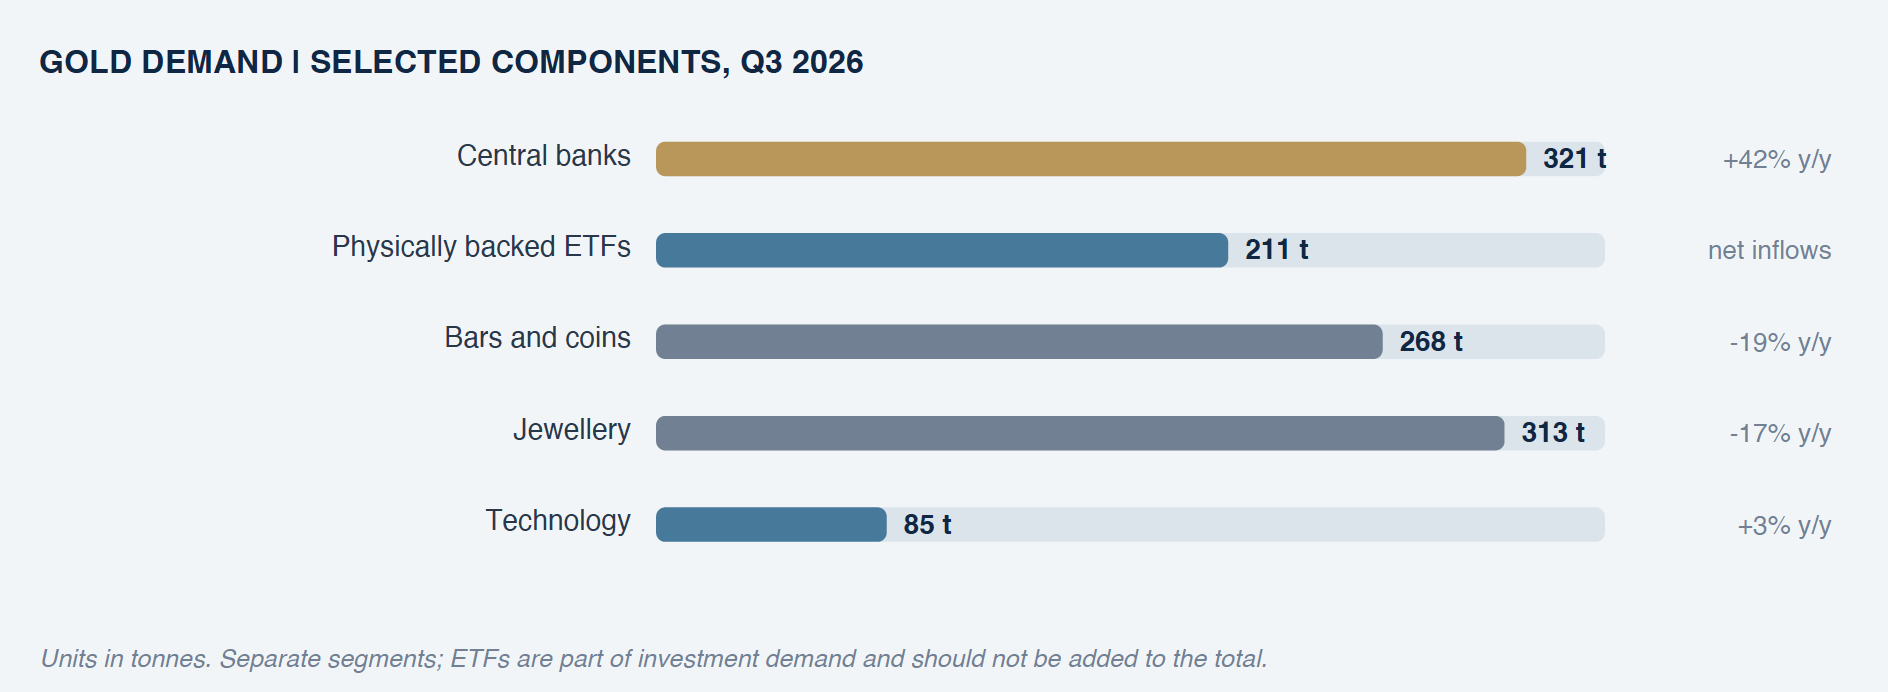
The strongest figure comes from the official sector: central banks bought 321 tonnes in the quarter, 42% more than a year earlier, bringing year-to-date purchases to 675 tonnes. This demand reflects diversification and reserve risk management, but it is no guarantee of unlimited buying at any price. Decisions can slow and flows are not evenly distributed.
Physically backed ETFs also returned to inflows: 211 tonnes in the quarter, with global holdings at a record 4,256 tonnes. This is an important signal because it links the price to financial flows, not only to demand for physical metal. If inflows slowed, marginal support would fade even with official buying still in place.
Weakness is visible among consumers. Demand for bars and coins fell 19% year on year to 268 tonnes; jewellery consumption fell 17% to 313 tonnes, the lowest third-quarter figure in the available series. Technology, by contrast, rose 3%, supported partly by AI-related production.
02 | Price moves with rates, the dollar and risk
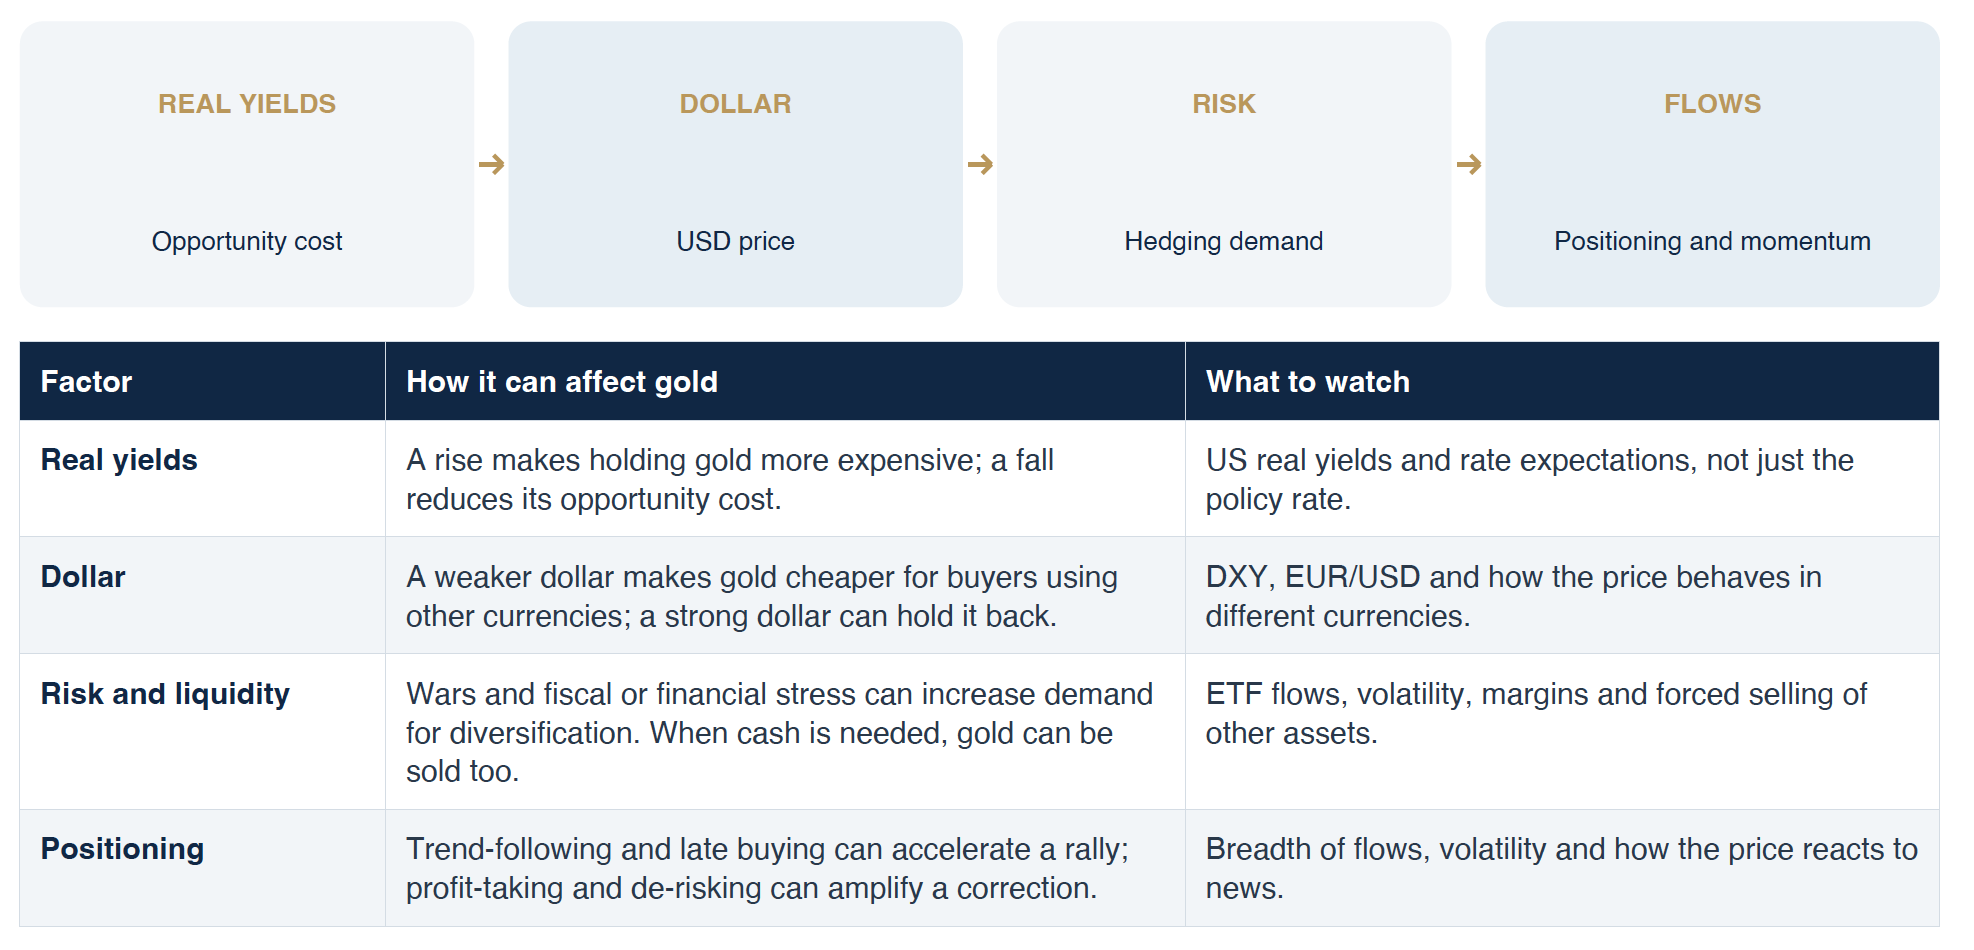
Gold pays no coupons or dividends. That is why the comparison with bond yields is central: when real yields rise, so does the opportunity cost of holding an asset that generates no cash flow. When yields fall, the dollar weakens or demand for hedging grows, gold tends to find support. These are useful relationships, not mechanical laws: liquidity, positioning, Asian demand and official buying can change their intensity.
The post-election session is a useful example. On 4 November gold rose by around 3.4%; the following day it gained around 1.6% in early European trading, supported by a weaker dollar and falling Treasury yields. At the same time, equities rallied strongly. The metal can therefore rise even in a “risk-on” session if currency and rate moves outweigh safe-haven demand.
The US 10-year yield fell towards 4.87% in Asian trading on 5 November, after a drop of around six basis points overnight. This is supportive for the metal in the short term, but the figure to follow is the trajectory of real yields and inflation expectations. A lower nominal yield is not automatically positive if expected inflation falls faster.
03 | Physical gold, listed products and mining companies
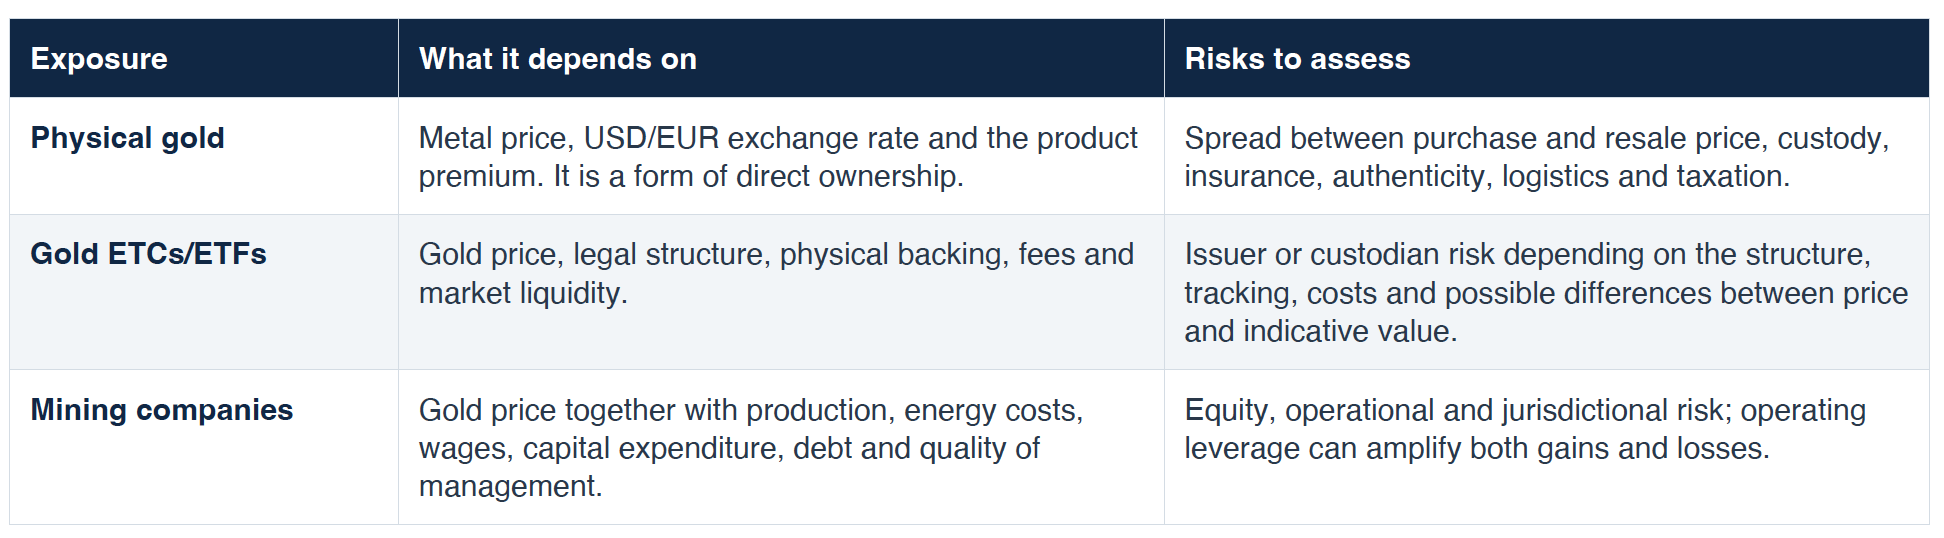
“Gold” does not mean a single exposure. Physical metal, a gold-backed listed product and a mining company respond to different drivers. Confusing them can lead to underestimating the risk being taken.
For holders of bars, the spot price is only the starting reference. Actual performance also depends on the purchase currency, the premium paid, the cost of custody and the price actually achievable on resale. If gold is bought in euros but priced in dollars, the EUR/USD exchange rate can increase or reduce the return measured in the investor’s currency.
The recent cycle is a reminder that a safe-haven asset can be volatile. In 2026 the price rose above $5,500, then fell below $4,000 and hit a low of $3,869.85 on 30 October. From the low to the $4,123.71 quote on 5 November the recovery was around 6.6%, but the price remained around 25% below January’s intraday high. These percentages compare intraday extremes with a spot quote: they describe the size of the move, not the return on a portfolio.
The methodological point: the structural thesis on gold and the tactical decision to buy or sell are two different horizons. A long-term conviction does not remove the need to assess price, portfolio weight, liquidity, costs and the ability to withstand a correction.
Gold can contribute to diversification, but it does not replace cash, bonds or instruments aligned with the investor’s objectives. Its role depends on the portfolio as a whole and on the reason it is held.
On the supply side, mine production rose 3% to 1,071 tonnes, a quarterly record. Recycling fell 8% to 314 tonnes, a three-year low. The supply response remains limited: high prices do not immediately translate into new production, but over time investment can expand mining capacity.
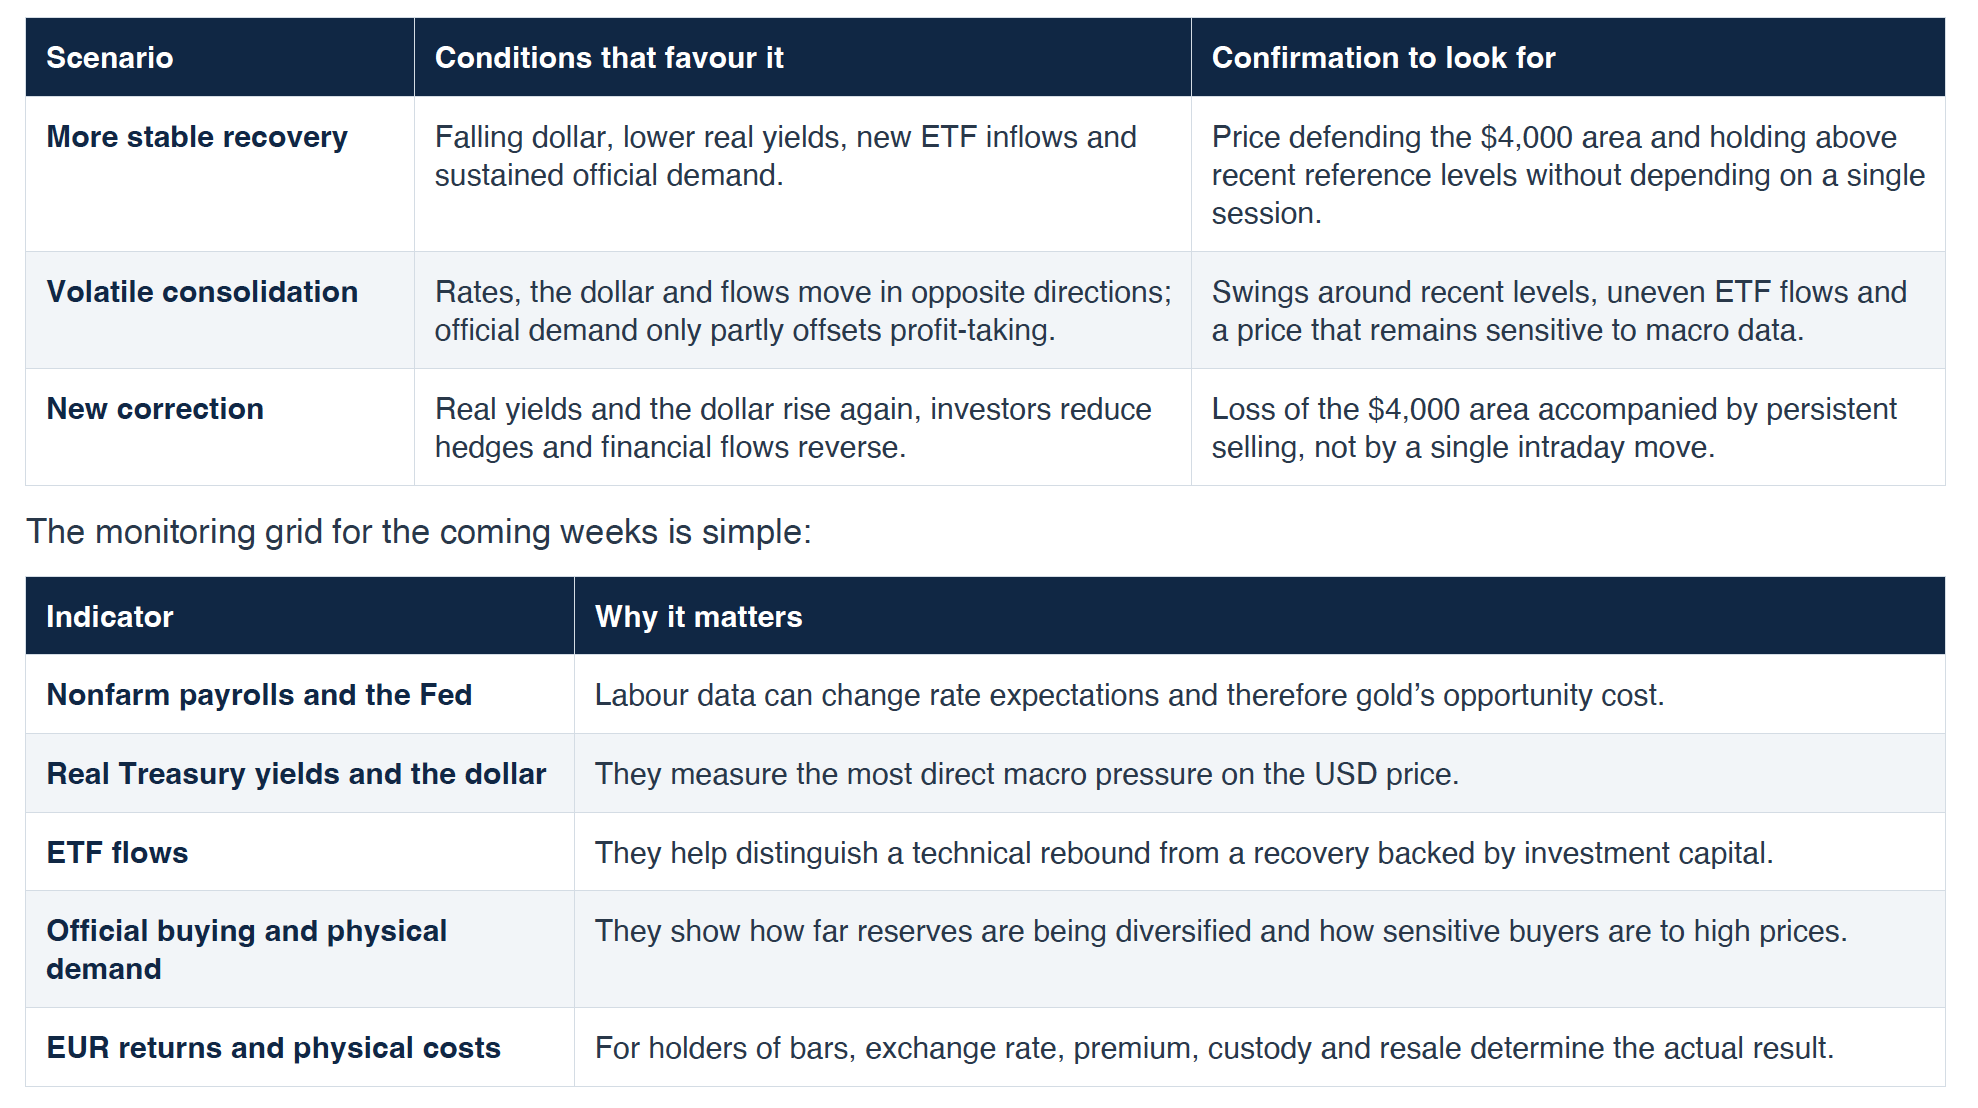
04 | Scenarios and conditions to monitor
Conclusion | Gold protects, but carries an opportunity cost
Structural demand remains in place, and the third-quarter data confirm substantial buying by central banks and ETFs. But the market is less uniform than the price alone suggests: retail buyers have reduced volumes, jewellery is suffering from affordability, and flows can change quickly with yields, the dollar and risk appetite.
The rebound above $4,100 improves the short-term picture, but confirmation requires follow-through. If the dollar and yields remain favourable and financial inflows continue, the recovery from the October correction could consolidate. If instead the opportunity cost rises again and flows reverse, the hedging function will not prevent further swings. The price shows which force prevails in the short term; risk management decides how much that volatility weighs on the portfolio.
THE AUTHOR
Giancarlo Prisco is a financial analyst specialising in investment evaluation, financial strategy and corporate training. Operating across Europe and South America, he supports businesses with tailored financial solutions and training programmes designed to improve performance and drive sustainable growth.
Disclaimer. This document is for information and analysis purposes only; it does not constitute financial advice, a personal recommendation, an offer or a solicitation to buy or sell financial instruments. Prices and demand data refer to the times and periods stated in the document.
Your next step
Speak to an adviser
Tell us what you need. The JURIS team will review your enquiry and help you find the right support.